The pace of product development requires you to work faster and smarter. Senior product management professionals often rely on their experience and gut instincts to make quick decisions, but that’s not the most compelling way to convince management about the direction of your roadmap.
Whether you’re just getting started or have millions of users, understanding how your products are being used helps you prioritize development, meet customer requirements and build consensus with stakeholders throughout the product life cycle.
Software usage analytics offer detailed tracking and analysis of how users interact with applications. These analytics provide insights about when and how to improve the user experience, prioritize feature enhancements, measure user adoption, track compliance, and provide real-time user help. Software providers and application developers are leaning on these analytics to understand users’ behaviors, and Gartner predicts that, by 2021, 75% of software providers will rely on these insights to inform product management decisions and measure customer health.
Collecting and analyzing software usage data helps experienced product professionals validate their instincts. For junior team members, it offers the opportunity to test their hypotheses so they can make faster, more efficient decisions at all stages of the development cycle.
Design and Implementation Stages
Defining minimum requirements usually is a joint decision between product management and engineering. In the absence of data, these decisions often are driven by the HiPPO—the highest-paid person’s opinion. On the other hand, gathering basic statistics can lead to big wins.
Building information modeling software vendor Solibri discovered this when it began collecting information on the characteristics of users’ computer environments (e.g., memory, processor speed, screen resolution).
Just six weeks into capturing product usage data—including detailed anonymous system configuration information—Solibri discovered that its customer base was using more powerful computers than it previously believed. That meant developers could implement features that required more robust hardware—they knew their customers’ hardware environments greatly surpassed the existing minimum requirements.
Similarly, the product team at a healthcare practice management software provider was struggling to manage a feature written in legacy code with obsolete tools. Whenever engineering upgraded the user interface, the feature would break—costing already-scarce time and resources. The product team wanted to drop the feature, but decision-makers were reluctant to do so for fear of alienating existing customers. The product team didn’t have reliable information about how many customers still used the feature, so it kept delaying the decision to abandon it—while maintenance costs and frustrations continued to grow.
By tracking software events, the company quantified the number of unique users who actively engaged with the legacy feature—and discovered that only a few still did. Product management could now support a decision to sunset the feature with accurate, reliable data that demonstrated a minimal customer impact. The company also used this data to drive a customer success campaign to engage with those legacy users and educate them on newer functionality to meet their specific needs.
Release Stage
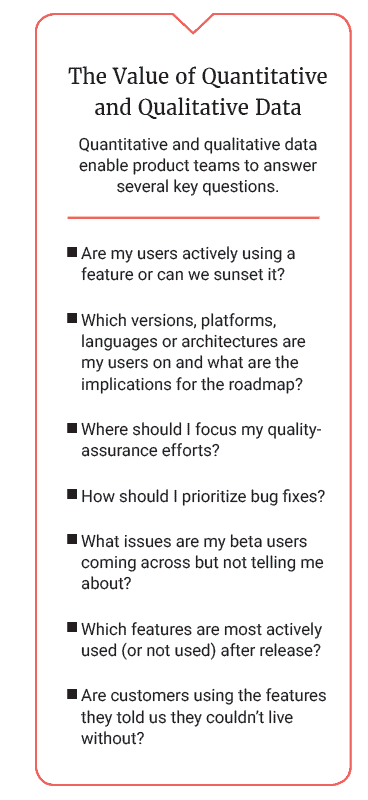
Prioritizing resources is a constant challenge—especially when you’re facing a particularly loud complaint about broken functionality. Are other users experiencing the same bug? Is it limited to a specific environment or is it affecting your entire user base? Software usage data enables product teams to be proactive. Instead of waiting for users to report bugs, exception and stack trace reports help product professionals react more quickly and efficiently, squashing bugs before more customers experience them.
Beta programs also can benefit from usage analytics. Product teams can measure beta users’ activity and whether specific functionality is being adequately tested. If your product launch depends on the success of three new features, they must be properly vetted. Are beta users not finding the new features (suggesting a possible user interface/user experience issue)? Are they abandoning the features before completion of the expected path of steps (suggesting a workflow issue or an actual bug)?
By combining usage data with in-app messaging, product teams can send targeted messages to segments of beta users to educate them on new features with videos or web-based tutorials. They can ask for immediate feedback on a specific experience or offer the next steps for evaluation once the desired usage threshold is achieved.
Prioritization also involves knowing where not to focus.
“We had an acute problem,” said Toby Martin, CEO at Extensis, a developer of software and services for creative professionals and B2B workgroups. “We’ve been around since long before any runtime intelligence was available, and we really didn’t know what was happening with customers who’d been with us for many years or even decades. We had no data to support our intuitive sense of how they used our applications.”
Historically, and out of fear of the unknown, Extensis had supported every different browser flavor and operating system. Then the company introduced analytics.
“With software usage analytics, we know exactly what customer environments actually exist,” Martin said. “Since we can now direct my QA resources more effectively, we’ve been able to decrease waste on edge cases and configurations that are rarely used.” For the company, this has already translated to savings of $10,000 to $20,000 per release in QA time alone.
“As we shifted toward agile methodologies, we required a more quantitative way to echo the customer’s voice in development,” he said. “We wanted to prioritize features more effectively and understand more about our use cases—both to improve existing solutions and to drive entirely new ones.”
Post-Release Stage
After you collect data on product usage, you can start to ask deeper questions: What are users doing with the product? How are they engaging with it? What kinds of users are they?
CNC Software wanted to overhaul the user interface for its Mastercam CAD/CAM software product, which had been in place for nearly 10 years. Understanding how to organize and logically group the software’s 1,200 features was critical. Analyzing usage data identified which features were most often used, which went together, and which to promote. It even broke feature adoption down by geography, making it possible to identify usage patterns for each of the 19 languages it supports as well as collaborate with its global reseller network to optimize adoption.

Likewise, with the ability to collect and analyze usage data, product teams can inform future feature development, validate decisions and drive user engagement. When it came to building enhancements for TechSmith’s flagship screen capture and editing tool, Snagit, there was skepticism about spending time and resources to enhance nascent video functionality in the software.
By analyzing the functionality, the product team was able to see that a significant and growing number of customers leveraged the video features. This insight helped convince the company to add webcam support in Snagit 13 and continue to build more robust video features.
TechSmith also wanted to ensure users recognized the value of the upgrade and quickly adopted it. The company believed the video enhancements would appeal to customers who used related functionality in the previous version. With anonymous usage data, TechSmith was able to identify specific profiles of use and push targeted in-app messages about the new functionality. For example, users would see an in-app banner with an embedded thumbnail video. When they clicked the video, they’d see Snagit’s strategy lead, Daniel Foster, offering a customized call to action based on how the upgrade should be purchased.
The Best Time to Plant a Tree
The Chinese proverb which says “the best time to plant a tree was 20 years ago, the second-best time is now” certainly applies to usage data. It’s easy to be overwhelmed by data and enter analysis paralysis, but even when you plant your usage-analytics tree today, it can still yield fruit quickly.
As Solibri’s decision to implement features requiring more robust hardware shows, even bringing six weeks of data usage into your product development life-cycle decision-making can make a difference. And there are even more quick wins product teams can achieve to affect decisions throughout the product development life cycle
- Quantify the variations and frequency of different display settings in your install base to help your user interface and user experience teams optimize their designs
- Identify geographies where your applications are being used to prioritize where localization efforts make the most sense
- Monitor adoption rates across all OS platforms and versions to better plan and time the development of new features that leverage the functionality of the latest OS
- Measure daily engagement and installation activity to assess whether it’s where you expect it to be so you can work better with cross-functional stakeholders to ensure success
From there, product teams can leverage usage data and analytics to dig deeper into engagement and ask more nuanced questions that bring additional insight and authority throughout the product life cycle. Whether you’re a seasoned product professional or just getting started, bringing data into the product development life cycle will help you deliver the products your customer wants—and will actually use.
Learn More
Certification Courses
Podcast
- Listen for Keith Fenech’s Nov. 29 podcast on PragmaticLive
Articles
Author
-

Keith Fenech, a seasoned Business Strategy Consultant with 21 years of experience, has made significant impacts at Ascent Software, GFI Software, and Revulytics, Inc. An entrepreneur with a passion for technology and startups, Keith brings a pragmatic and hands-on approach to his work. Having contributed to companies like Trackerbird, Yellowbit Solutions, and Silicon Valletta, he remains business-oriented and self-motivated. For questions or inquiries, please contact [email protected].
View all posts
