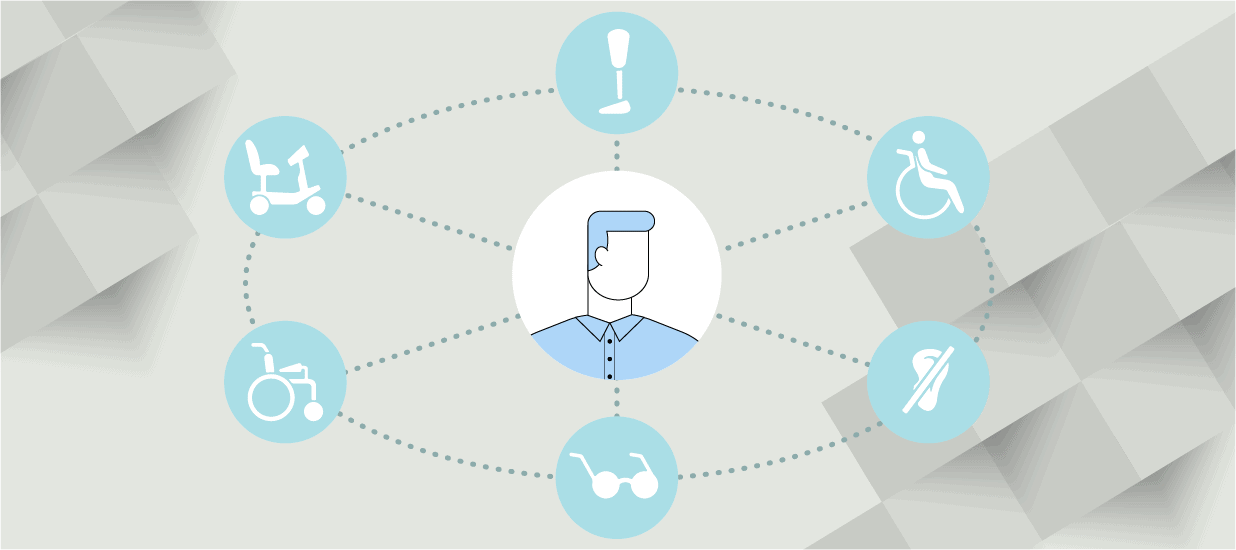
Companies must manage multiple websites and web-based tools to serve various groups, including customers, prospects, employees, channel partners, regulatory agencies, etc. To ensure these websites and apps are successful, measuring their performance accurately for each audience is essential.
Unfortunately, basic measurements of user-centered design are not enough to create websites and apps that cater to users’ unique needs. This work starts with separating aesthetics from function. A website might look great but may be challenging to navigate, which can be incredibly frustrating for users.
On the other hand, poorly designed websites or apps may function well, but they don’t align with the brand’s objectives. Achieving the perfect balance between aesthetics and function is difficult, but it’s crucial to remain competitive and retain customers.
To optimize the user experience, product managers must accurately measure how users interact with their websites and apps. This article outlines a three-stage User Experience Measurement Hierarchy and a simple approach to selecting the best user experience measurement tools and techniques.
User Experience Measurement Hierarchy
Stage 1: Most organizations are in stage one. They likely have general knowledge of their users’ online experience. This is understandable because measuring user engagement can seem costly and complicated, and user-centered design best practices are widely available.
Stage 2: Leading organizations are often in this stage. They’ve moved on to trying to understand user behavior. They’re seeing significant returns on investment, such as increased revenue, reduced support costs, and improved customer satisfaction.
Stage 3: Few organizations make it to this stage. This is when they’re using sophisticated methods to influence users, and there is plenty of opportunity in this stage.
| Stages | Need | Recommended Tools | Ideally Suited For… |
| Stage One General Knowledge |
Provides a basic sense of site or web application performance |
|
Getting a big-picture sense of performance and major weaknesses |
| Stage Two Understand User Behavior |
Identify what users are doing and where problems exist |
|
Documenting user behavior and understanding why users are not completing tasks |
| Stage Three Influence Your Users |
Determine whether a website or application is compelling |
|
Measuring user thinking to compel and persuade users to act |
Stage 1 – General Knowledge
In the first stage, organizations are typically working with “heuristic analyses” or best practices to create assumptions about users. Whether performed by an internal usability expert or a usability consultant, the result is an “informed guess” of what users need.
Tools to find out general knowledge about the user include:
1. Heuristics
Heuristics refer to web standards and research from cognitive sciences that identify best practices in interaction styles, page layout and visual design. When conducting a heuristic evaluation, usability issues typically relate to interface aspects that are relatively easy to demonstrate, such as colors, layout and information structure, consistency of terminology and consistency of interaction mechanism.
2. Expert Review
An expert review is a quick evaluation of a website or application conducted by specialists in user-centered design. This review can help take your user experience measurement to the next level by systematically rating your performance on relevant dimensions such as navigation effectiveness, content selection, visual presentation, branding and interaction simplicity. Companies like UserTesting and Trymata offer user testing services for your website or app. You could find contractors or hire a UX designer.
3. Website Analytics
Website analysis involves using tools such as Google Analytics, Mixpanel and Kissmetrics. Tools like these provide insight into the number of pages visited and viewed, typical navigation flow, key drop-off locations, bounce rates and conversion metrics. When combined with customer relationship management data, website analysis is an effective way to map and understand user behavior.
However, it’s crucial to remember that web analytics/usage metrics rely on assumptions about user behavior and how those assumptions align with your web goals. While these tools can help assess the relative success of your website in achieving business goals, it’s challenging to determine if they accurately meet the needs of your target audience(s). The knowledge gained from web analytics may be too general to understand individual user thinking and persuade them to act or change their online behavior.
Stage Two – Understanding User Behavior
The user-centered behavior metrics in this stage can provide an in-depth analysis of obstacles to accomplishing tasks on your site(s) and applications.
To truly understand what your target audience is doing online, you must study a representative sample of individual users. In-depth analysis is typically accomplished through user (usability) test sessions performed remotely or in person.
These sessions will reveal much more about how users anticipate the site, how the application works, and what design issues might stop a user from accomplishing key tasks.
The best tools for understanding user behavior include:
4. User Testing
User testing is highly effective in designing for specific user groups. User testing can be done in person, in a focus group or remotely. It involves interviewing individuals who are representative of your target audience.
You can determine ease of use and find recommended improvements by asking them to accomplish specific, representative tasks. Through this work, you can gather first-hand information about how users behave.
User testing is often most effective early in the design process, before development and visual design.
The advantage of user testing is you learn what the target audience can and can’t accomplish, understand why users are having trouble, how to correct it and receive direct feedback.
The disadvantages are obvious: it can be more expensive to test individuals, especially when dealing with multiple user types and many test participants. In addition to finding a testing facility and moderator costs, there are also costs to recruit and compensate test participants.
5. Session Analysis
Session analysis involves studying multiple single-user transactions, live or replayed, based on certain criteria (e.g., error message present, drop-off at buy button). They can reveal information about the user’s path and how to correct flow problems.
With session analysis tools like Hotjar and MouseFlow, you can create heat maps and recordings of anonymous users browsing your website.
These tools provide detailed naturalistic web session analysis, monitoring and replaying individual sessions and capturing the user experience either live or replayed for specific individuals.
Error messages, broken links or users deviating from the expected path reveal critical system weaknesses. The ability to produce a recording of an individual user’s sessions—including the page sequence, form inputs and button selections—can help find and correlate an individual user’s behavior to application errors.
6. Online Surveys
Collecting larger population samples through online surveys is a quick and inexpensive way to capture likes and dislikes, most common feature requests and summary information about a user persona. It is important to collect larger population samples to ensure that in-depth studies represent the target audience.
Companies like Qualtrics provide various intercept survey options integrating best practices from web analytics, market research and other tools, such as the University of Michigan’s American Customer Satisfaction Index (ACSI), to help companies convert satisfaction data into user-driven web development strategies.
7. A/B and Multivariate Testing
A/B and multivariate testing allow alternative designs to be tested and measured with a small segment of users. Tools like Google Optimize and VWO are just a few available options.
The beauty of A/B and multivariate testing is they offer the ability to isolate and assess the performance of virtually every element of a website, landing page or application.
Stage Three – Influence Your Users
It has never been enough to “put something out there” that works. To influence users, you must directly measure what users think. Websites and applications must be compelling to the users to be successful and for key influencers to spread the word about their positive experiences.
Increasingly, sites are ranked on their persuasiveness and influence on user thinking rather than just the ability to accomplish a goal.
The following tools are ideal for understanding user experience and satisfaction:
8. Eye Tracking
Eye tracking is a technique that has long been used in vision science and can be applied to user testing. By recording where users are looking first, what is capturing their attention and what they choose to act on, eye tracking can provide insights into the user’s behavior and thought process. It goes beyond measuring overt behavior and can provide a window into the user’s thinking.
Eye tracking studies are particularly effective in an online publishing environment; for example, in news and entertainment sites. By testing a subset of a target audience, product managers can gain powerful insight into critical data unavailable through any other means:
- What first captures readers’ attention when visiting the page
- How often do readers see the diversity of news and content the publication offers
- Where readers are looking versus where they click
Tobii is a leader in eye-tracking research, and they offer several eye-tracking products. Eyequant is another tool that utilizes AI to help with eye-tracking projects.
9. Emotion/Trust Measurement
Various measurements, such as skin conductance, heart rate, facial emotion detection, and mood surveys, are used to determine how users feel while using websites and digital tools. There is an increasing consensus that explicit tools (such as surveys) and implicit tools (such as emotion detection) are necessary to understand user motivations.
Of course, there is the tried and true Net Promoter Score (NPS), a customer satisfaction metric that measures how likely customers are to recommend a product or service to others.
There are also tools like Affectiva that use AI software to detect human emotion. Emotient provides emotion detection software that uses machine learning algorithms to analyze facial expressions and detect emotions in real time.
10. Neuro-marketing
While only a few tools have made their way from neuroscience laboratories, some applications of Electroencephalogram (EEG) technology and functional Magnetic Resonance Imaging (fMRI) are being used in the commercial arena to measure the engagement and emotional response to user experience. These tools provide a window into user satisfaction.
The critical feature of these technologies is to measure the experience of your target audience and understand what they find compelling and appealing. Using these techniques, you can also identify which messages are most effective and what dictates trust and positive emotion from your website or web application.
The disadvantages of these “higher level” measurement techniques are many. They require more equipment and analysis. Given their lack of widespread adoption, it can be difficult to achieve buy-in within your organization to pursue such an initiative. Finally, product managers are cautioned to develop a realistic return on investment model before diving in because they cost so much.
Measuring and managing experience
While there may be limitations in terms of time and cost when measuring user experience, there is a clear progression in the sophistication of user experience measurement. This progression ranges from a general knowledge of user experience to the ability to influence user behavior. Regardless of the level of sophistication, gathering as much information as possible is important.
Pragmatic’s Insight Course
What do you do with all the data you capture? How do you make sense of it, and how do you take action on it? Pragmatic’s Insight course teaches you how to identify patterns within your data to uncover and prioritize the problems you should be solving. You also learn how to employ a scalable and repeatable process for successful data projects.
Author
-

The Pragmatic Editorial Team comprises a diverse team of writers, researchers, and subject matter experts. We are trained to share Pragmatic Institute’s insights and useful information to guide product, data, and design professionals on their career development journeys. Pragmatic Institute is the global leader in Product, Data, and Design training and certification programs for working professionals. Since 1993, we’ve issued over 250,000 product management and product marketing certifications to professionals at companies around the globe. For questions or inquiries, please contact [email protected].
View all posts


